


You just closed a $12,000 project. Great work. Client was thrilled. Paid on time. Left a five-star review. You’ll never hear from them again. That’s the pattern, isn’t it? Close the project, deliver great work, move on to the next one. You’re not retaining clients. You’re completing transactions. One and done.
Here’s what that costs you. If you have 50 clients per year at $10,000 average transaction size, that’s $500,000 in revenue. But what if those same 50 clients each came back just one more time? Same work quality. Same service. Same you. That’s $1 million in revenue without generating a single new lead.
Most service business owners see themselves as project completers. You’re good at delivery. You close projects on time, on budget, with happy clients. But that identity traps you. Project completers move from one client to the next. Business builders create ongoing relationships that generate multiple transactions per year. The difference isn’t skill. It’s how you see your role.
What Is Client Retention (Really)?
Client retention isn’t just keeping clients from disappearing. It’s increasing transaction frequency. It’s the difference between a client who hires you once (1.0 transaction frequency) and a client who hires you three times per year (3.0 transaction frequency). That difference triples your revenue per client without increasing lead generation, marketing spend, or sales effort.
The Transaction Frequency Solution
Here’s a question most service business owners have never considered: What if client retention rates don’t actually matter? What if a 95% retention rate with 1.2 transaction frequency generates less revenue than a 75% retention rate with 3.5 transaction frequency? The goal isn’t keeping clients from leaving. The goal is designing your business so retained clients buy multiple times per year.
Industry research shows that acquiring a new customer costs 5 to 25 times more than retaining an existing one. Think about what you spend to land a new client: marketing costs, sales time, proposal development, risk assessment, onboarding effort. Then think about what it costs to serve an existing client again: a phone call, maybe an updated proposal, minimal onboarding because they already know your systems. The profit margin on repeat business is dramatically higher than on first-time business, yet most service businesses spend 80% of their effort chasing new clients while existing clients disappear.
Two companies, both serving $100K annually. Company A retains 90% of clients with 1.2 transaction frequency. Company B retains 75% of clients with 3.5 transaction frequency. Company B makes three times more revenue despite lower retention. Why? Because they designed their service delivery to create multiple buying opportunities per year, not just one.
This isn’t about learning new sales tactics or becoming more aggressive with upsells. It’s about becoming the kind of business owner who thinks in relationships, not projects. Who designs service delivery around ongoing value creation, not one-time transactions. Who sees each client as a multi-year partnership, not a single project. That identity shift changes everything.
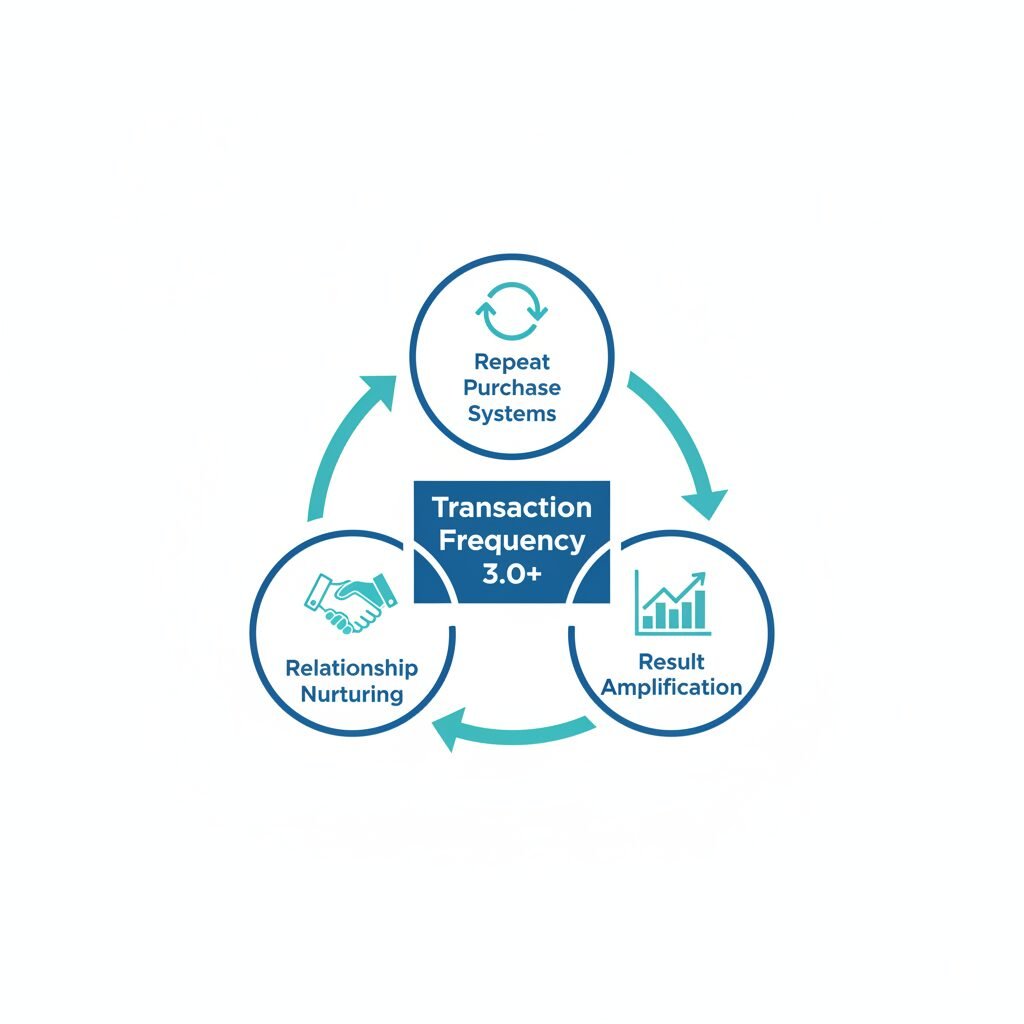
Business owners who generate high transaction frequency without aggressive selling use what I call the 3 R’s of Client Retention: Repeat Purchase Systems, Relationship Nurturing, and Result Amplification. These aren’t tactics you add to your existing business. They’re structural decisions about how you package services, maintain relationships, and demonstrate value that make repeat purchases the natural next step.
You finish a project. Invoice the client. Move to the next one. There’s no natural next step built into your service delivery. No reason for the client to come back except if they happen to need you again. But here’s what’s important: this isn’t because you’re failing. It’s because nobody showed you how to design services differently. Once you see it, you can’t unsee it.
There’s a pattern across accounting firms: 85% retention but only 1.1 transaction frequency because most clients just get annual tax returns. When firms restructure service delivery around quarterly strategy sessions, monthly bookkeeping touch-points, and semi-annual tax planning, transaction frequency jumps to 4.2 times per year with the same clients. Revenue increases 73% without a single new client. The firms don’t become better accountants. They become business builders.
The 3 R’s of Client Retention
Creating high transaction frequency requires three systems most service businesses never build. These aren’t about pushy sales or manipulative upselling. They’re structural decisions about how you package services, maintain relationships, and demonstrate value that make repeat purchases the natural next step. The difference between 1.2 and 3.5 transaction frequency is these three systems. More importantly, implementing them changes who you become as a business owner. You stop being the person who completes projects and moves on. You become the person who builds lasting partnerships.
Calculate Your Current Transaction Frequency
Before implementing the 3 R’s, you need to know where you stand. This isn’t about judging yourself. It’s about seeing your business clearly so you know which system to prioritize.
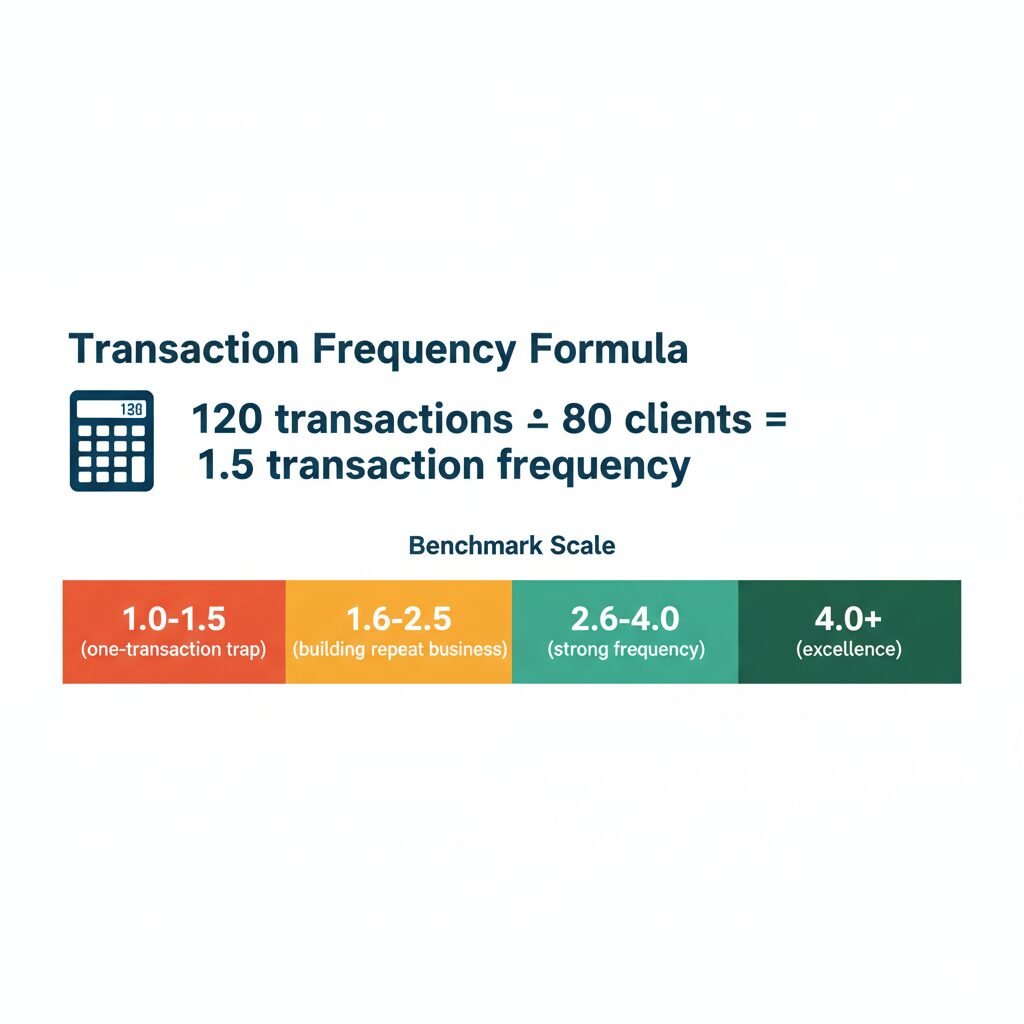
Count total transactions last 12 months. Not total clients, total individual purchases, projects, or engagements. Then count unique clients last 12 months. How many different people or companies bought from you? Divide transactions by clients. That’s your transaction frequency.
Here’s an example. 120 transactions divided by 80 clients equals 1.5 transaction frequency.
Now benchmark your results. If you’re between 1.0 and 1.5, you’re in the one-transaction trap. Most service businesses are here. You’re not alone. Between 1.6 and 2.5 means you’re building repeat business. Good progress. Keep going. Between 2.6 and 4.0 is strong transaction frequency. You’re in the top 20%. You’re onto something. Above 4.0 is retention excellence. Top 5%. You should be teaching others.
Whatever your number is, it’s not a judgment. It’s data that shows you where to focus.
Understanding Retention Rate Benchmarks (And Why They Don’t Tell the Whole Story)
Before diving into the 3 R’s, let’s address the question everyone asks: what’s a good client retention rate? Industry benchmarks vary by service type. Accounting firms typically see 85 to 95% retention. Consulting businesses average 70 to 85%. Trade businesses like HVAC or plumbing run 60 to 75%. Marketing and creative agencies land around 65 to 80%. Professional services like law or architecture hit 75 to 90%.
Those numbers sound reassuring if you’re in range. But here’s the problem: retention rate doesn’t tell you if you’re profitable. A 90% retention rate sounds great until you realize those retained clients only buy once per year at shrinking margins because you’re competing on price to keep them. Meanwhile, a business with 70% retention but 3.5 transaction frequency at premium pricing makes far more profit.
How to calculate your retention rate if you want to know: divide the number of clients who bought this year and last year by the total number of clients who bought last year. If you had 100 clients last year and 85 of them also bought this year, that’s 85% retention.
The question isn’t “Is my retention rate good?” The question is “Are my retained clients generating multiple transactions at healthy margins?” That’s why transaction frequency matters more than retention rate. You can’t control whether clients need you again, but you can design your services to create natural reasons for them to buy multiple times per year.
R1: Repeat Purchase Systems (Structural Design)
Most service businesses structure work as discrete projects with clear end dates. Project starts, project completes, relationship pauses until client needs something else. That structure creates 1.0 to 1.5 transaction frequency by design. Not because you’re failing, but because the structure doesn’t create natural next steps.
Implementing repeat purchase systems isn’t about learning new project management tactics. It’s about becoming the kind of business owner who thinks in phases instead of projects, in ongoing relationships instead of one-time transactions. Once you make that mental shift, the tactics become obvious.
Structure services in phases, not projects. Instead of “website design” as one transaction, offer “digital presence buildout” with Phase 1 for foundation, Phase 2 for optimization, Phase 3 for expansion. Same work, different structure. Client commits to three transactions upfront instead of one.
Create ongoing agreements with built-in touch-points. Retainers, maintenance agreements, quarterly reviews. Not because you’re upselling, but because the nature of your work requires ongoing attention. Marketing agencies build monthly performance reviews into every campaign.
Design natural upgrade paths. Entry service leads to next-level service leads to premium service. Not upsells. Natural progression as client needs evolve. A consultant might structure: assessment as transaction 1, strategy development as transaction 2, implementation support as transaction 3, optimization coaching as transaction 4.
There’s a pattern with consulting firms that sell individual assessments at $8,000 each, averaging only 1.1 transactions per client. When they restructure into three-phase engagements with diagnostic in Month 1, strategy build in Months 2 through 3, and implementation support in Months 4 through 6, transaction frequency increases to 3.0 because clients see the three phases as one continuous engagement, not three separate purchases. Revenue per client jumps from $8,800 to $24,000 with the same total work and pricing, just different structure. The consultants don’t become better at their craft. They become partnership builders.
HVAC companies that only respond to emergency calls average 1.0 transaction frequency. When they bundle annual maintenance agreements with every installation including spring tune-up, fall tune-up, priority emergency service, and parts discount, transaction frequency increases to 3.2. The company creates predictable revenue while clients get better equipment performance and lower long-term costs. Same technical expertise, different service structure.
Once you understand phase-based design, you can apply it to any service business. You don’t need anyone to redesign your services for you. You need the lens to see your work differently. Then the restructuring becomes yours to navigate.
R2: Relationship Nurturing (Staying Top of Mind)
Repeat purchase systems create the structure. Relationship nurturing ensures clients actually use it. This is where most service businesses fail. They deliver great work, invoice, disappear until the next project starts. The client relationship goes cold. When the client needs service again, they start fresh vendor evaluation instead of automatically returning to you.
What if staying in touch between projects isn’t about sales? What if it’s about genuine partnership? Most business owners avoid relationship nurturing because it feels like pestering clients. But that feeling comes from seeing touch-points as sales attempts instead of value delivery. Change the belief, change the behavior.
Implement systematic touch-points between transactions. Not sales calls. Value-delivery touch-points. Quarterly industry updates. Semi-annual strategy check-ins. Monthly insights relevant to their business. These aren’t excuses to pitch. They’re legitimate value delivery that keeps the relationship warm.
Create educational cadence. Newsletter, blog, video series that helps clients succeed whether they buy again or not. An HVAC company sends seasonal energy efficiency tips. A marketing agency shares quarterly digital trends reports. An accountant publishes monthly tax strategy updates. The content creates multiple value-delivery moments per year outside of paid engagements.
Build celebration and milestone recognition. Anniversary of working together. Achievement of goals you helped them reach. Major business milestones you’re aware of because you actually pay attention. These moments strengthen relationships without requiring additional purchases.
Law firms often struggle with transaction frequency around 1.2 despite 85% client satisfaction scores. Clients appreciate the work but only call when legal emergencies arise. When firms implement quarterly “legal health check” emails with no cost, just proactive observations about changing regulations relevant to client industries, and semi-annual calls to discuss business changes that might have legal implications, transaction frequency increases to 2.8. Clients think of the firm as ongoing advisors, not emergency responders. More work becomes proactive instead of reactive. The firms become partners, not vendors.
Service providers disappear between projects. Partners stay present. When you see yourself as a partner in your clients’ success, relationship nurturing stops feeling like extra work and starts feeling like the whole point.
R3: Result Amplification (Demonstrating Ongoing Value)
Clients continue buying when they see clear, measurable results from previous work. Most service businesses deliver results but never systematically demonstrate or amplify them. The client knows the work was good, but they don’t have concrete evidence of value delivered. Result amplification is the systematic process of measuring, documenting, and communicating value so clients see exactly what they gained.
You already deliver great results. You’re good at what you do. But clients forget specifics three months after a project ends. This isn’t about becoming better at delivery. It’s about honoring the work you’ve already done by making the value undeniable.
Measure and report outcomes, not just deliverables. Don’t say “we delivered 12 blog posts.” Say “traffic increased 40%, leads increased 28%, your content now ranks for 15 target keywords.” Don’t say “we completed the installation.” Say “energy costs decreased 35%, system reliability improved 90%, emergency calls reduced from 4 per year to zero.”
Create value documentation at regular intervals. Quarterly results reports. Semi-annual outcome reviews. Annual impact summaries. These aren’t invoices. They’re evidence of value delivered. They remind clients why they hired you and why they should continue.
Build comparison frameworks that show improvement over time. “When we started working together, your conversion rate was 12%. After six months, it’s 28%. Here’s the revenue impact of that improvement.” Concrete numbers. Clear causation. Obvious value.
Marketing agencies with great client relationships often struggle to move transaction frequency above 1.5. Most clients run one 6-month campaign, then pause. When agencies implement quarterly “Marketing ROI Reports” showing specific metrics including traffic change, lead generation change, conversion rate change, and revenue attributed to marketing, and clients see concrete numbers showing $85,000 in revenue generated from $12,000 in marketing spend, continuing the relationship becomes obvious. Transaction frequency increases to 3.2 because value is impossible to ignore.
Once you see the power of documenting results, you can build your own measurement frameworks. You don’t need complex software. You need commitment to tracking what matters and sharing it regularly. That’s yours to own.
What to Expect: Transaction Frequency Improvement Timeline
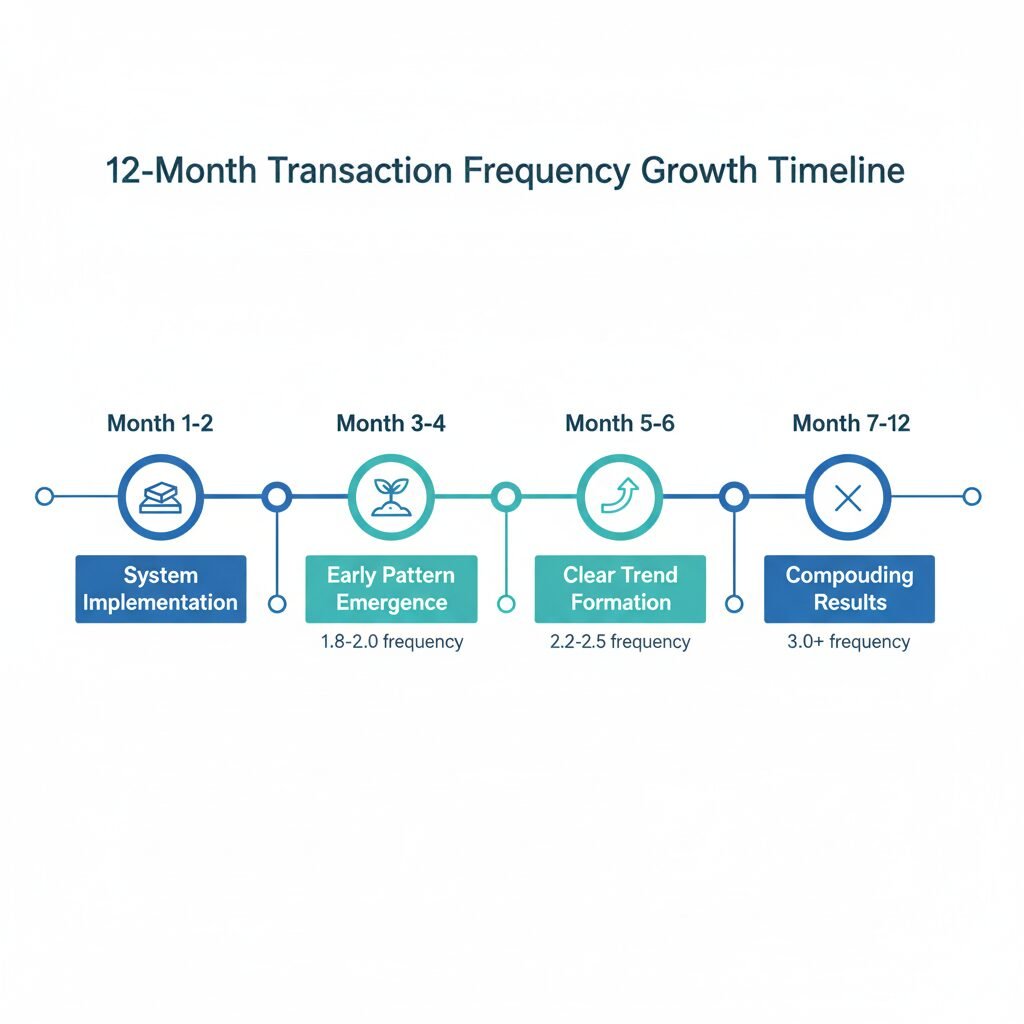
Most business owners expect transaction frequency to improve immediately. When it doesn’t, they abandon the systems before they have time to work. Understanding realistic timelines prevents this mistake.
During Month 1 and 2, you’re in system implementation. You’re building repeat purchase structures, setting up relationship nurturing touch-points, and creating result documentation frameworks. This feels slow because you’re not seeing revenue results yet. You’re laying foundation. The first repeat purchases from new systems typically happen in Month 2.
Month 3 and 4 bring early pattern emergence. You start seeing clients who completed Phase 1 moving into Phase 2. Relationship nurturing creates inbound inquiries from past clients. Result amplification triggers conversations about expanding scope. Transaction frequency begins climbing from baseline (1.2) toward 1.8 to 2.0.
Month 5 and 6 show clear trend formation. The pattern becomes undeniable. Multiple clients are on their second or third transaction. Your repeat business percentage climbs. Transaction frequency hits 2.2 to 2.5. You can project with confidence that sustained effort will reach 3.0 or higher by Month 12.
Month 7 through 12 deliver compounding results. The second half of the year is where transaction frequency improvement accelerates. Clients who started in Month 1 are on transaction 3 or 4. New clients immediately enter the system. By Month 12, transaction frequency has doubled or tripled from baseline without any increase in lead generation or marketing spend.
This timeline assumes consistent implementation. If you build systems in Month 1 but don’t use them until Month 4, add three months to every milestone.
Don’t Leave Revenue on the Table
Client retention isn’t about preventing unhappy clients from leaving. It’s about increasing transaction frequency so each client generates 2 to 3 times more revenue without requiring you to generate more leads, spend more on marketing, or work longer hours.
The 3 R’s create that transformation. Repeat Purchase Systems structure your service delivery to create natural next steps. Relationship Nurturing keeps you top of mind between transactions. Result Amplification demonstrates concrete value so continuing the relationship is obvious.
But here’s what matters most: implementing these systems changes who you are as a business owner. You stop being the person who completes projects and chases new clients. You become the person who builds partnerships and generates predictable revenue from existing relationships. That identity shift is worth more than any tactic.
Right now, you’re probably operating at 1.0 to 1.5 transaction frequency. If you moved that to 3.0, you’d triple revenue with the same client base. Same delivery quality. Just different structural design.
Find Your Transaction Frequency Opportunity
I’m currently interviewing service business owners for the second edition of Profit Foundation, my book on profit strategies for small businesses. During these 45-minute conversations, I walk through the 7-Step Pathway to Profit and analyze your current transaction frequency. Most business owners discover they’re leaving $50,000 to $150,000 on the table annually just by not having repeat purchase systems in place.
It’s a research conversation, not a sales pitch. I’m gathering client retention patterns for the book while sharing what I’ve observed across different service industries. You’ll walk away knowing your exact transaction frequency, which of the 3 R’s would have the biggest impact for your business, and a specific strategy to increase repeat purchases in the next 90 days.
If you’d like to participate and receive a free copy of the book when it’s published in 2026, you can schedule here: https://mediaaceadvisors.com/contact/
There’s no cost and no pitch. Just a strategic conversation about becoming the kind of business owner who builds lasting partnerships instead of chasing one-time transactions. If that sounds like who you want to become, let’s talk.
About the Author:I’m Ryan Herrst with Media Ace Advisors. I help service business owners with annual revenue between $250,000 and $3 million identify hidden profit opportunities and create clear pathways to growth. My approach focuses on systematic improvements across all seven profit levers, with special emphasis on transaction frequency optimization and designing service delivery that creates multiple buying opportunities per client per year.
One Response
Giao diện website của nhà cái chính là điểm cộng lớn đối với các bet thủ lần đầu truy cập. app xn88 Trang chủ có sự kết hợp hài hoà giữa 2 tone màu đỏ – đen vô cùng bắt mắt tạo nên vẻ đẹp sang trọng, đẳng cấp. Ngoài ra, các bố cục website cũng được sắp xếp rất logic để người mới dễ dàng thao tác. TONY03-20