


If your revenue grew last year but your bank account didn’t feel it, you’re living inside the Q1 Profit Paradox. It’s not a sales problem. It’s a margin problem hiding in plain sight. This post explains why service businesses get busier without getting more profitable, and the three places where your money is disappearing before you ever see it.
🎧 Prefer to Listen? I turned this article into an audio deep-dive perfect for your commute.
You told the team it was your best year yet.
Maybe you announced it at the holiday party. Maybe you sent the email. Maybe you just said it out loud to yourself driving into work one morning in January. Revenue was up. You’d grown. Whatever the number was, it was bigger than the year before, and that felt like proof that everything was working.
Then Payroll Friday happened.
Not dramatically. No alarms, no overdraft notice, no emergency call to your accountant. Just you, ten minutes before the payroll run, opening your bank app with that familiar tightening in your chest. The kind that doesn’t match the story you’ve been telling everyone, including yourself. The balance was fine. You covered it. But “fine” and “proud” are two completely different feelings, and the gap between them is exactly where the Q1 Profit Paradox lives.
This isn’t a crisis. It’s something quieter than that, and somehow harder to fix because of it. Revenue went up. You worked harder than ever. But the reward didn’t match the effort, and you’re not entirely sure why. That confusion is the first sign something important is misaligned in your business model, and it’s worth paying attention to before Q2 starts moving too fast to think clearly.
If you’ve ever wondered why more leads never seem to actually solve the problem, you’re already asking the right question.

Why Does Revenue Growth Feel Like Running in Place?
Most service business owners are conditioned to treat revenue as the scoreboard. More revenue means winning. Less revenue means something’s broken. It’s a simple story, and it’s wrong in ways that cost people six figures a year without a single dramatic moment to point at.
The real scoreboard is net profit margin. That’s the percentage of your revenue you actually keep after every cost has been paid. Not gross profit. Not revenue. The number that’s left when everything is settled. Most business owners know this in theory and ignore it in practice because revenue is visible and exciting, while margin is quiet and uncomfortable to look at honestly.
Here’s the reframe that changes everything. Your business can be completely booked, perfectly busy, and still be financially stressed, and none of that is a personal failure. It’s a design problem. The machine wasn’t built to keep as much as it generates. And the response most owners reach for, which is pouring in more water by chasing more clients and more leads, is exactly the wrong move when the bucket has holes in it.
All because you can, doesn’t mean you should. More revenue without understanding your margin is just a faster leak.
Before you plan Q2, it’s worth asking the question your P&L isn’t answering: where is what I have going? The 7 profit levers that actually drive growth start with understanding what you’re keeping, not what you’re generating.
Why Did My Costs Go Up But My Net Profit Margin Stay the Same?
This is the question most service business owners are living inside right now, even if they haven’t put those exact words to it yet.
According to the NFIB Small Business Economic Trends report, small business owners have faced sustained cost increases across nearly every category of operation over the past three years, including labor, materials, insurance, and overhead. The owners who felt this most acutely weren’t the ones with the tightest budgets. They were the ones who absorbed the increases without adjusting their pricing, because adjusting pricing felt riskier than staying quiet.
Here’s what that decision actually cost them. If your operating costs went up 15% and your prices stayed flat, you didn’t break even. You worked harder for a smaller piece of what you were already generating. The margin gap closed quietly, one month at a time, until the bank account started telling a different story than the revenue line.
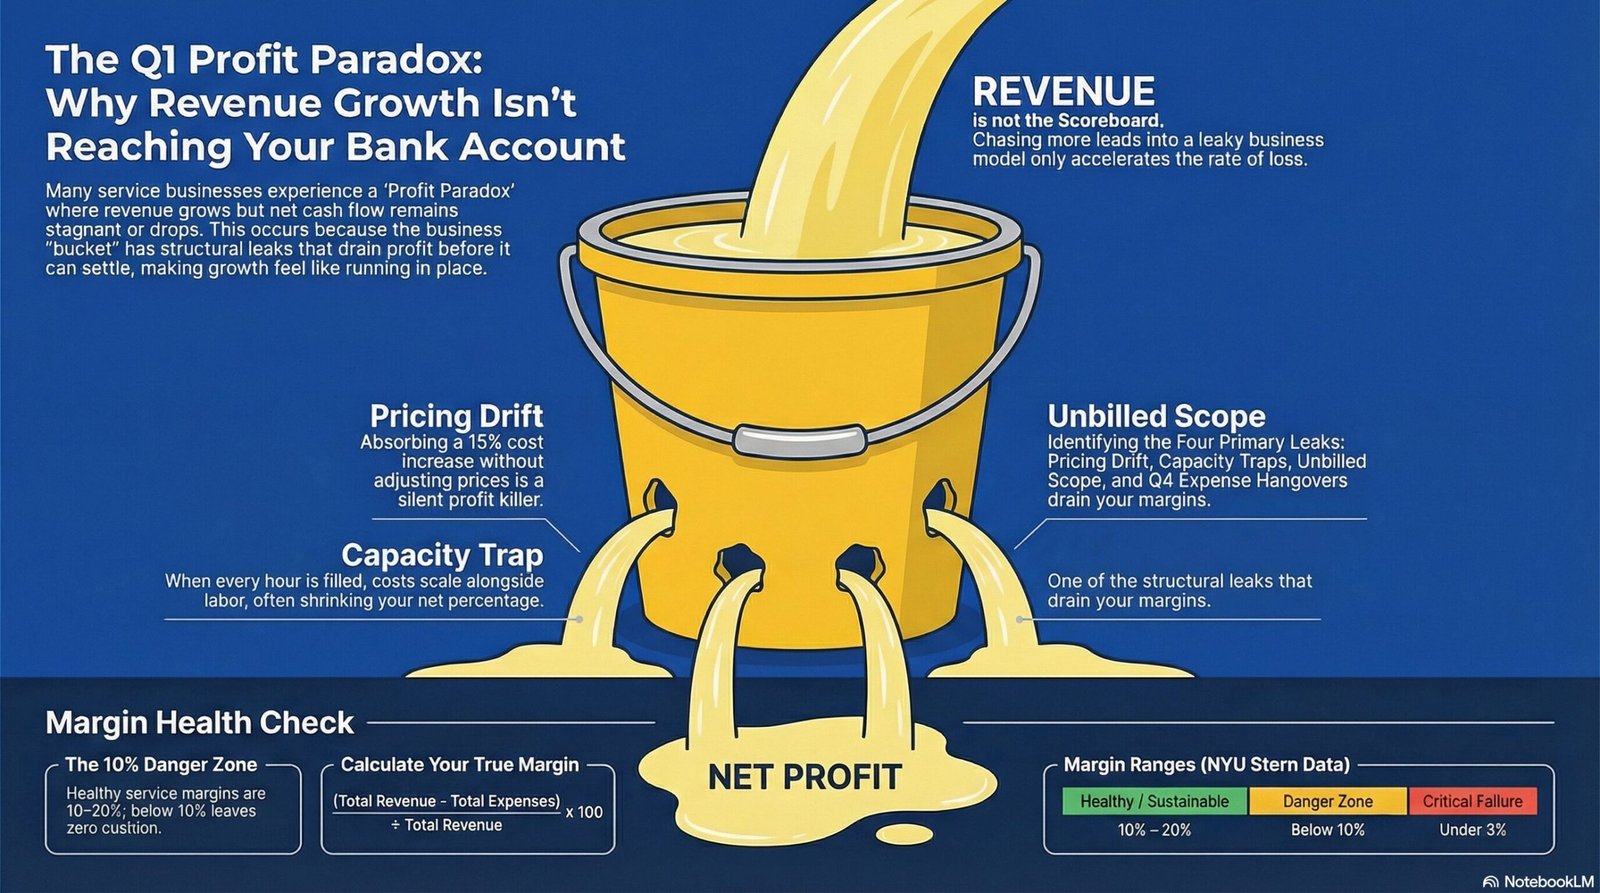
The math is simpler than it feels. Net profit margin is calculated as your total revenue minus your total expenses, divided by your total revenue, expressed as a percentage.
30-Second Margin Health Check
Net Profit Margin = (Total Revenue – Total Expenses) ÷ Total Revenue × 100
If that number is below 10%, you are in the Danger Zone, regardless of how much revenue your business generated.
According to margin data published by the NYU Stern School of Business, net profit margins for consulting and service businesses typically range between 10% and 20% when the business is healthy. Below 10%, there is almost no cushion for a slow month, a late payment, or an unexpected cost. Many of the service business owners I speak with regularly are operating somewhere between 6% and 9% margin and don’t know it because revenue keeps the lights on and makes the problem feel invisible.
The most dangerous version of this pattern is when owners try to solve a margin problem with a pricing adjustment that’s too timid. A 3% price increase on a business running at 7% net margin barely moves the needle. What’s needed is a real pricing audit that starts with understanding your actual cost structure, not a gut-feel adjustment designed to keep you comfortable and your clients comfortable at the same time.
I spent 27 years in healthcare, 17 of them in the ICU and the rest in surgical suites. In the ICU, we were trained to understand that the number on the monitor is rarely the whole story. Tachycardia (a fast heart rate) looks like a heart problem. It’s often anemia. You can treat the fast heart rate all day long, but if you don’t address the bleeding underneath it, the patient deteriorates despite every intervention looking busy and purposeful. In service businesses, the same principle holds. Chasing revenue while margin erodes is treating the wrong thing. The profit problem your business has almost certainly has nothing to do with revenue.
One thing worth noting here: if pricing is the issue, the solution isn’t random. When I work through a price increase with a business owner, it’s intentional and calculated, grounded in their specific cost structure and market position. There’s no guesswork. The difference between quietly bumping prices and making a strategic pricing decision is the difference between hoping and knowing.
How Can You Have High Revenue but Low Cash Flow?
This is the capacity trap, and it catches some of the most talented service business owners I’ve met.
A business that is fully booked is not the same as a business that is profitable. When every hour on your calendar is filled, every cost scales with it. Labor increases with workload. Materials and supplies track job volume. The overhead that felt manageable at 60% capacity starts pressing harder at 95% capacity because the cost structure expanded to support the volume. Your gross profit might look reasonable. Your net profit margin is a different number, and the gap between them is where the Q1 Profit Paradox does most of its quiet damage.
There’s a diagnostic question worth sitting with before you plan your next growth push. If your revenue doubled tomorrow, would your profit double too? For most service businesses, the honest answer is no. Doubling revenue typically means doubling labor, doubling delivery costs, adding management overhead, and increasing the number of moving parts that need constant attention. The margin percentage either stays flat or shrinks, and the owner ends up working twice as hard for roughly the same take-home number.
This is exactly what surfaced repeatedly in conversations I’ve had with service business owners while researching the second edition of Profit Foundation. Working more, loving the work, and struggling to keep the margin they needed. One graphic designer described being booked six and seven days a week, loving every project, and then watching the numbers at year-end and feeling confused. Revenue was strong. The margin wasn’t moving. “Working more for less” came up across so many different industries that it stopped feeling coincidental and started feeling structural. Because it is. If you recognize that description in your own business, the burnout that follows is not a rest problem. It’s a model problem, and you cannot rest your way out of a broken machine.
Identifying where your capacity becomes a cost problem rather than a profit driver is exactly the kind of analysis a structured Profit Audit is designed to surface. It’s not a spreadsheet exercise. It’s a diagnostic that asks which revenue is actually worth keeping, and which revenue is costing you more per hour than it’s returning. That’s the distinction that separates operational efficiency from operational exhaustion.

How Do You Fix a Cash Flow Crunch in Q1?
The Q1 cash flow crunch is structural. It is not seasonal, and it is not a sign that your business is broken. But it is your responsibility to understand before it repeats again next January.
Here’s what typically happens. Q4 brings a cluster of expenses. Year-end vendor payments, equipment purchases, holiday payroll adjustments, and often a slowdown in collections as clients close out their own fiscal year. By the time January arrives, those costs are already baked in. Revenue from December invoices collects in January. January invoices collect in February. Operating cash flow takes the hit before any new revenue has a chance to catch up. And in that gap, most service business owners make one of two reactive decisions, both of which make the underlying problem worse.
The first is cutting something they shouldn’t. Often it’s the expenses that feel optional but are actually generating future revenue, including follow-up processes, client retention activities, and the attention they give to their highest-value relationships. The psychology of client retention tells us that the clients most worth protecting in a cash-tight Q1 are the ones generating the highest profit per hour, not necessarily the highest total revenue. Cutting the wrong costs in January creates a Q2 problem you didn’t have in December.
The second reactive move is chasing new clients from a place of scarcity. When the bank account feels thin, urgency creeps into sales conversations. Prices get negotiated down. Scope gets widened to close the deal faster. The average transaction size shrinks exactly when it needs to grow. SCORE, a resource partner of the U.S. Small Business Administration, provides cash flow forecasting templates designed to help business owners map their receivables timeline before the crunch arrives. The owners who come out of Q1 strongest aren’t the ones who worked hardest in January. They’re the ones who thought most clearly in December about which overhead costs were actually negotiable and built a plan before the gap opened, not a reaction after it did.
The strategic planning approach that actually moves the needle for service businesses starts with understanding cash timing, not just revenue projections. A plan that ignores the 45 to 60 day lag between delivering work and collecting payment is a plan built on an optimistic fiction.
What You’re Seeing vs. What’s Actually Happening
The Q1 Profit Paradox shows up differently for every business, but the misalignments underneath it follow a consistent pattern across industries and revenue levels. Here is what service business owners typically tell themselves, and what the numbers are usually revealing underneath it.
| What You’re Seeing | What’s Actually Happening |
| “I need more clients.” | Your margin per existing client is too low. More volume makes the problem bigger, not smaller, because every new client adds costs alongside revenue. |
| “I need to cut expenses.” | You don’t know which expenses are actually hurting profit versus which ones just make you uncomfortable to look at. Cutting without a diagnostic creates new problems. |
| “We had a great year.” | Revenue grew. Net margin didn’t move. The business got bigger without getting more profitable, which means the next hard year will hurt more, not less. |
| “Q1 is always slow.” | Your expense structure from Q4 is making Q1 feel worse than the revenue actually justifies. The slowness is structural, not cyclical. |
These four misalignments are the first things we look for in a Profit Audit.
Does This Sound Like Your Q1?
Here are four questions worth sitting with before you plan the rest of the year.
Do you know your actual net profit margin right now? Not revenue. Not gross. The number after every cost is paid. If you had to answer that question in the next five minutes without opening your accounting software, could you give a confident answer?
If your biggest client paused for 90 days, would you feel confident or scared? That answer tells you more about your real financial cushion than your revenue number does.
Did your bank account feel like a fair translation of last year’s effort? Or did the work and the reward feel out of proportion in a way you couldn’t quite explain to someone else?
Are you planning Q2 by asking “how do I get more” before you’ve honestly asked “where is what I have going?”
If any of those landed, you’re not behind. You’re just looking at the wrong number. Most service business owners don’t have a lead problem. They have a margin problem they haven’t named yet. Every quarter this goes unnamed is a quarter you’re subsidizing your own business with your personal financial security, and that’s not why you built this. You built it for the opposite reason.
Ready to See What’s Actually Happening in Your Business?
I’m currently speaking with service business owners for the second edition of Profit Foundation, specifically about how Q1 cash flow and margin challenges show up across different industries. If what you read here sounds like your Q1, I’d genuinely love to hear your perspective.
These are 45-minute research conversations. No sales pitch on the other side. Just a structured conversation where I walk you through what I’m learning across industries, you share what’s happening in yours, and most owners walk away with at least one specific insight about where their margin is going. You can book directly at mediaaceadvisors.com or reach me directly at 517-955-2154.
If you’re not ready for a conversation yet, the How to Improve Profit Margins by 10 to 20% post is a strong next read that takes the concepts here and shows you exactly where to look first.
About the Author
Ryan Herrst is a Certified Profit Advisor and the author of Profit Foundation. With 27 years in healthcare, including 17 years in the ICU and years in surgical suites, Ryan brings a diagnostic approach to business profit that most advisors don’t carry into the room. He works with service business owners generating $250,000 to $5 million annually, helping them find hidden profit opportunities without spending another dollar on marketing. Based in Grand Ledge, Michigan, Ryan serves clients locally and nationally through Media Ace Advisors.
ryan@mediaaceadvisors.com | 517-955-2154 | mediaaceadvisors.com