


It’s the last week of December, and you’re staring at your Stripe dashboard. Year-to-date revenue: $97,843. You wanted $100,000. You’ve wanted $100,000 for three years now. In six days, that number resets to zero, and you’ll be starting over. Again. Setting the same goal. Again. Wondering if you can actually hit it this time.
The worst part isn’t missing the goal. The worst part is knowing you worked as hard as you possibly could. You logged 60-hour weeks. You hustled. You said yes to every opportunity. You marketed consistently. And you still came up short. How much harder can you possibly work?
You’re not alone in this. Service business owners across every industry are sitting in the same spot right now. Looking at their QuickBooks or Stripe accounts. Seeing that year-to-date number that’s close but not quite there. $485,000 when they wanted $500,000. $1.2 million when they wanted $1.5 million. $47,000 when they wanted $75,000. The number doesn’t matter. The pattern is identical.
What Is a Business Breakthrough?
A business breakthrough isn’t about working harder. It’s not about hustling more. It’s not about getting lucky or finding the perfect strategy. A business breakthrough is when you identify and fix the one constraint preventing your growth, causing a rapid acceleration in revenue without a corresponding increase in hours worked. It’s the moment your business finally moves past the plateau you’ve been stuck on for years.
If you’ve been stuck at the same revenue level for two or more years despite working harder, you don’t have a work ethic problem. You have a constraint problem. You’re pulling the wrong lever. You’re focusing energy on areas that don’t actually move revenue. A breakthrough happens when you find the right lever and pull it consistently.
Why Hustle Won’t Create Breakthrough
The business advice industry tells you that breakthrough requires massive action, 10X goals, and relentless hustle. So you work 60-hour weeks. You add more services. You say yes to every opportunity. You market everywhere. And you stay stuck. That’s because hustle without direction is just exhausting noise.
Business breakthrough happens when you understand the seven profit levers in your business and identify which one is your constraint. Most service business owners are pulling the wrong lever. They focus on lead generation when their real problem is conversion. Or they chase new clients when their real opportunity is increasing transaction frequency with existing clients.
The Seven Profit Levers (Your Diagnostic Framework)
Every service business has seven profit levers that control revenue and profit: lead generation, conversion rate, transaction size, transaction frequency, profit margins, employee retention, and client retention. A business breakthrough happens when you identify which lever is your biggest constraint and focus exclusively on moving that lever. Everything else is distraction.
An HVAC company stuck at $850,000 for three years identified that their constraint was transaction size. Average job: $2,800. They bundled maintenance agreements with every installation and raised their average to $4,200. Revenue jumped to $1.3 million the following year. Same number of jobs. Same team. Different lever.
A marketing agency plateaued at $420,000 despite generating more leads every quarter. Their constraint was conversion rate at 12 percent. They implemented the Conversion Formula framework and improved to 28 percent conversion. Revenue grew to $680,000 without spending another dollar on marketing.
A law firm wanted to break $500,000 but kept landing at $475,000 annually. Their constraint was transaction frequency. Clients hired them once and never returned. They implemented quarterly check-in calls and a referral system. Transaction frequency went from 1.1 to 2.4 transactions per client. Revenue jumped to $720,000.
Notice what didn’t happen in these stories. Nobody worked harder. Nobody hustled more. Nobody added team members or expanded service offerings. They identified their constraint, focused on one lever, and breakthrough happened naturally. That’s the difference between exhausting yourself and creating actual growth.
You can’t see your own constraint because you’re inside the business. You think you need more leads because that’s the most visible problem. But more leads won’t help if your conversion rate is 8 percent when it should be 35 percent. Or if your profit margins are so thin that more revenue just means more stress.

The 3 Keys to Business Breakthrough
Creating a business breakthrough in 2026 requires three specific keys that most service business owners never implement. These aren’t conceptual ideas or motivational slogans. These are tactical systems that force breakthrough to happen. The difference between watching your Stripe account reset to zero again next December and actually hitting your revenue goal comes down to whether you implement all three keys consistently.
Is Your Constraint Obvious? Take This 5-Question Diagnostic
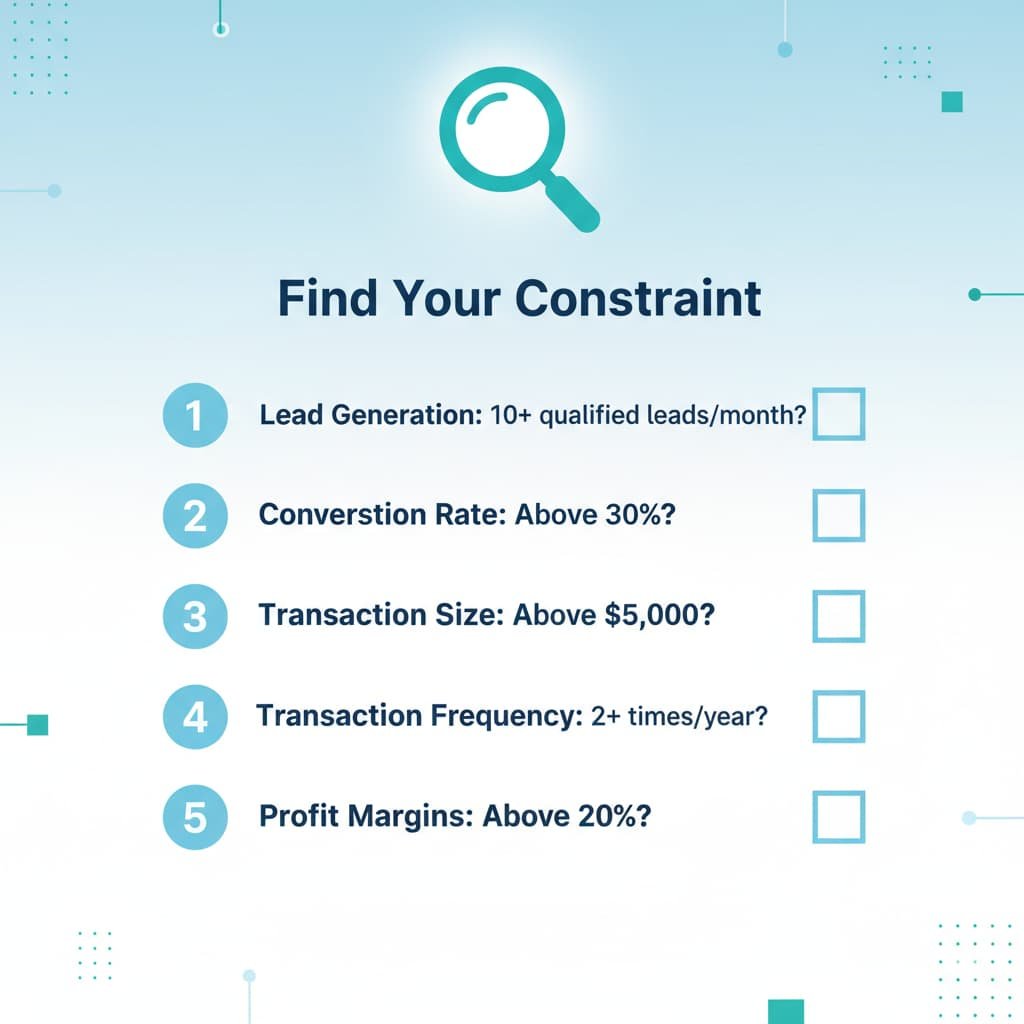
Before diving into the three keys, most business owners need help identifying which lever is actually their constraint. Answer these five questions honestly:
Question 1: Lead Generation
Are you generating at least 10 qualified leads per month? (Qualified means they have budget, need, and authority to buy)
Question 2: Conversion Rate
Do you convert more than 30 percent of qualified leads into paying clients? (Track this: closed clients divided by total qualified leads)
Question 3: Transaction Size
Is your average sale or project value above $5,000? (Calculate: total revenue divided by number of clients)
Question 4: Transaction Frequency
Do your clients buy from you at least twice per year on average? (Calculate: total transactions divided by total clients)
Question 5: Profit Margins
Are your net profit margins above 20 percent? (Calculate: net profit divided by total revenue)
Scoring Your Constraint:
If you answered “no” to Question 1, your constraint is lead generation. If you answered “yes” to Question 1 but “no” to Question 2, your constraint is conversion rate. If you answered “yes” to Questions 1 and 2 but “no” to Question 3, your constraint is transaction size. If you answered “yes” to Questions 1, 2, and 3 but “no” to Question 4, your constraint is transaction frequency. If you answered “yes” to Questions 1 through 4 but “no” to Question 5, your constraint is profit margins.
Most service business owners discover their constraint isn’t what they thought it was. That realization alone creates breakthrough momentum.
Key 1: Identify Your Actual Constraint (Diagnostic, Not Guessing)
Most business owners guess at their constraint. They assume they need more leads because that feels like the problem. But assumptions create wasted effort. Breakthrough requires diagnostic precision.
Calculate your current performance across all seven levers. Lead generation rate, conversion rate, average transaction size, transaction frequency, profit margins, employee retention rate, client retention rate. Write down the actual numbers. Not estimates. Actual data.
Compare each lever to industry benchmarks. A consulting firm should convert 40 to 60 percent of qualified leads. If you’re converting 15 percent, that’s your constraint. An HVAC company should average $3,500 to $5,000 per job. If you’re averaging $2,200, that’s your constraint.
Ask where a 10 percent improvement would create the biggest revenue increase. Improving lead generation by 10 percent might add $15,000 in revenue. But improving conversion rate by 10 percent might add $45,000. The biggest leverage point is your constraint.
Common Constraints by Service Business Type
Consulting firms most often face transaction size constraints. They’re charging $5,000 when they should charge $15,000. They undervalue their expertise and leave money on the table every engagement.
Trade businesses like HVAC, plumbing, or electrical typically face conversion rate constraints. They generate plenty of leads through referrals and local marketing but only close 15 to 20 percent when they should close 40 to 50 percent.
Marketing and creative agencies usually struggle with transaction frequency constraints. Clients hire them for one project and disappear. Average client lifetime is one transaction when it should be five to ten.
Professional services like accounting or legal face transaction frequency constraints similar to agencies. They do tax returns once per year or close one legal matter and never hear from the client again.
Construction and restoration companies often face profit margin constraints. They win projects but margins are so thin that more revenue creates more stress without more profit.
These patterns aren’t universal, but they’re common enough that if you’re in one of these industries, start your diagnostic by examining the typical constraint for your business type.
Real Application
A consulting firm calculated their levers and discovered their constraint was transaction size at $4,800 when industry standard was $12,000 to $18,000. They weren’t charging enough. They created tiered packages, raised prices 40 percent, and added implementation support. Average transaction size increased to $9,200. Revenue jumped 63 percent without generating a single additional lead.
Once you fix one constraint, another becomes your bottleneck. That’s growth. An accounting firm fixed conversion rate and their new constraint became transaction frequency. They solved that and profit margins became the next constraint. Breakthrough is continuous constraint identification and elimination.
Key 2: Set Quarter-by-Quarter Targets (Break Down the Annual Goal)
Annual goals create annual disappointment. You set $100,000 in January, check progress in June, realize you’re behind, panic in October, and miss it in December. Then you set $100,000 again next January. Breakthrough requires quarterly thinking.
Take your annual goal and divide by four. $100,000 becomes $25,000 per quarter. That’s $8,333 per month. Now you have a target you can actually track and adjust to in real time instead of realizing in December that you’re short.
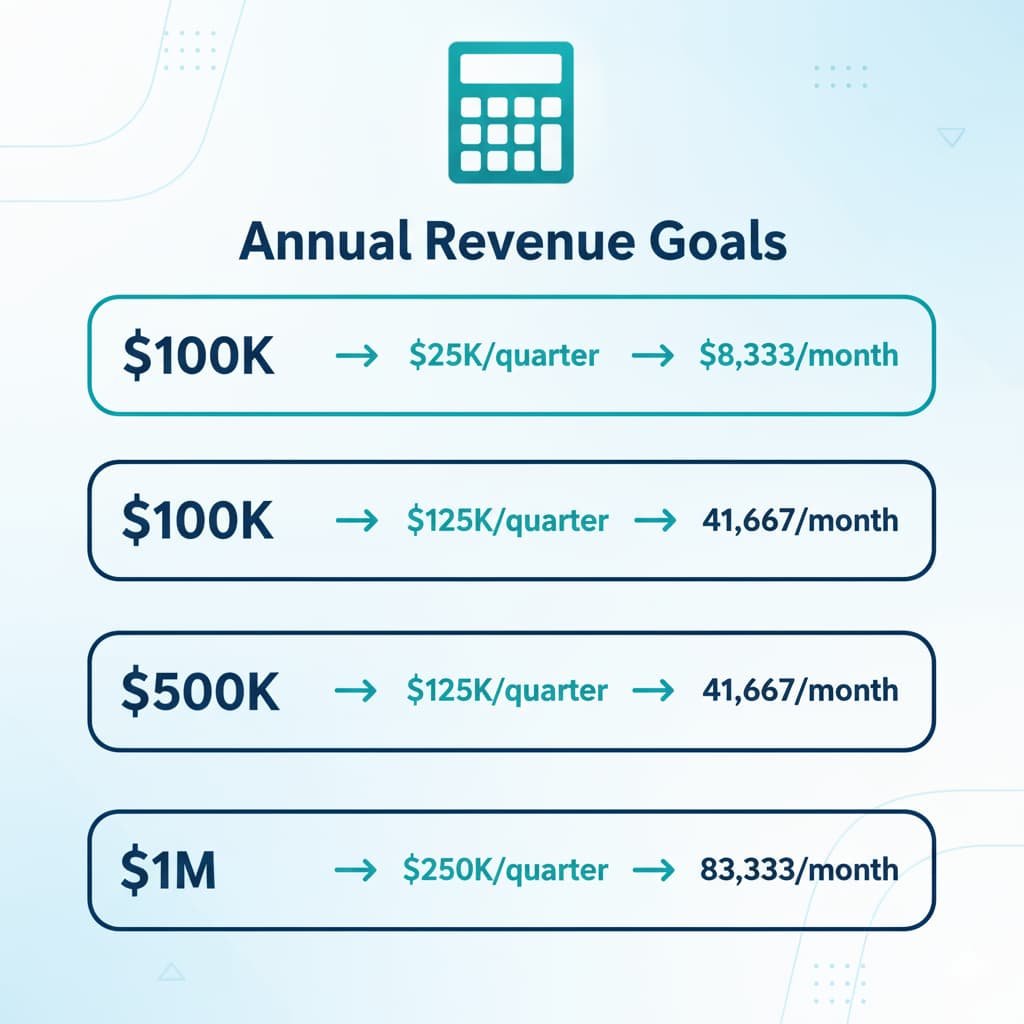
Quarterly Math for Common Revenue Goals
If your annual goal is $100,000, your quarterly target is $25,000, which breaks down to $8,333 per month. That means roughly two clients at $4,000 each per month, or eight clients at $1,000 each, or one client at $8,000. Suddenly the goal feels concrete instead of abstract.
If your annual goal is $500,000, your quarterly target is $125,000, which is $41,667 per month. For a service business averaging $5,000 per transaction, that’s eight to nine transactions per month. You can plan for that.
If your annual goal is $1 million, your quarterly target is $250,000, which is $83,333 per month. At $10,000 average transaction size, that’s eight transactions per month. At $15,000 average, it’s five to six transactions. The math makes the goal manageable.
Breaking annual goals into quarterly and monthly targets transforms them from aspirational wishes into tactical plans. You know exactly how many transactions you need, which means you know exactly what your constraint work needs to produce.
Set quarterly constraint targets for your identified lever. If your constraint is conversion rate currently at 18 percent, set quarterly targets: first quarter achieve 22 percent, second quarter achieve 28 percent, third quarter achieve 35 percent, fourth quarter maintain 35 percent. Each quarter has a specific measurable outcome.
Review and adjust every 90 days, not every 365 days. At the end of first quarter, if you didn’t hit $25,000, you have three more quarters to adjust. If you wait until December to review, you have zero quarters left to fix it.
Annual goals feel distant and abstract. Quarterly goals feel urgent and achievable. Breaking $100,000 feels impossible when you’re at $30,000. Breaking $25,000 in the next 90 days feels doable. Quarterly thinking creates momentum. Annual thinking creates disappointment.
Real Application
A restoration company set a $750,000 annual goal and missed it three years running. They broke it into quarterly targets of $187,500. In the first quarter they hit $192,000. That early win created confidence. Second quarter they hit $201,000. They finished the year at $823,000, exceeding their original goal by 10 percent simply because quarterly targets created accountability annual targets never did.
Key 3: Create Accountability Systems (Monthly Check-Ins, Not Yearly Hope)
Setting goals without accountability is just wishful thinking. Breakthrough requires structure, measurement, and external accountability to prevent you from abandoning the goal when things get hard in March.
Schedule monthly constraint review meetings with an accountability partner, advisor, or peer group. Not annual planning sessions. Monthly constraint reviews. Did conversion rate improve this month? Did average transaction size increase? What’s blocking progress?
Track your primary constraint metric weekly. If conversion rate is your constraint, calculate it every Friday. If you’re not measuring it weekly, you’re not serious about improving it. What gets measured gets managed. What gets ignored stays stuck.
Create consequences for missing quarterly targets. Not punishments. Consequences. If you miss first quarter target, you commit to doubling your focus on the constraint in second quarter. If you miss second quarter, you hire external help to fix it. Accountability requires stakes.
The 6 Month Rule (And Why Quarterly Is Better)
You may have heard of the six month rule in business, which suggests giving any new strategy at least six months before deciding if it’s working. The idea is sound. Real change takes time. But six months without any check-ins is too long. You could waste half a year heading in the wrong direction.
Quarterly check-ins are superior to the six month rule because they give you course-correction opportunities. After three months, you have enough data to see trends without waiting so long that you’ve wasted massive time and resources. If something isn’t working at the three-month mark, you can adjust for months four, five, and six instead of discovering at month six that the entire approach was flawed.
Monthly reviews catch problems even earlier. If your first quarter target is $25,000 and you only hit $18,000 in January, you know in February you need to adjust. If you only review every six months, you don’t know you’re behind until it’s too late to fix.
Real Application
A marketing agency joined a quarterly peer advisory board that required monthly metric reporting. Knowing they’d have to report conversion rate every month forced them to actually track it. That visibility alone improved conversion from 14 percent to 23 percent because they couldn’t hide from the number anymore. Accountability creates action.
What to Expect: Your Business Breakthrough Timeline
Most business owners expect breakthrough to happen in 30 days. When it doesn’t, they abandon the approach and try something new. Understanding realistic timelines prevents this mistake.
Month 1: Identify Your Constraint
The first month is diagnostic. You’re calculating your seven levers, comparing to benchmarks, and identifying your actual constraint. You’re setting quarterly targets and building accountability systems. This month feels slow because you’re not seeing revenue results yet. That’s normal.
Months 2-3: Implement Changes, Gather Early Data
The second and third months are implementation. If your constraint is conversion rate, you’re testing new sales scripts, improving your proposal process, and training your team. You’re starting to see early data. Maybe conversion improved from 18 percent to 21 percent. It’s progress, but it doesn’t feel like breakthrough yet.
Months 4-6: Clear Trend Emerging
By month four, the trend becomes obvious. Conversion rate is now at 28 percent and climbing. You can see that if this continues, you’ll hit your quarterly target. Month five confirms it. By month six, you’re exceeding targets and the constraint has shifted. Now you need to identify the next constraint.
Months 7-12: Compounding Results
The second half of the year is where breakthrough becomes undeniable. You’ve fixed your first constraint, identified your second constraint, and you’re systematically eliminating bottlenecks. Revenue is accelerating not because you’re working harder but because you’re removing what was blocking growth. By December, you’re not watching your Stripe account reset to zero with disappointment. You’re celebrating exceeding your annual goal.
This timeline assumes consistent execution. If you identify your constraint in January but don’t actually implement changes until April, add three months to every milestone. Breakthrough timelines are directly tied to execution speed.
Don’t Watch the Reset Again
In six days, your year-to-date revenue resets to zero. You’ll open Stripe or QuickBooks on January 1st and see $0. You’ll set a goal. Probably the same goal you’ve set for the last few years. And if nothing changes, you’ll watch that goal slip away again next December.
Business breakthrough doesn’t happen by accident. It doesn’t happen because you hustle harder or hope more. It happens when you identify your actual constraint, set quarterly targets around fixing that constraint, and create accountability systems that force you to follow through. The three keys aren’t complicated. But most business owners never implement them because they’re focused on hustle instead of systems.
The difference between 2026 being another disappointing year and being the year you finally break through comes down to what you do in the next 30 days. January is your window.
Find Your Constraint Before Q1 Ends
I’m currently interviewing service business owners for the second edition of Profit Foundation, my book on profit strategies for small businesses. During these 45-minute conversations, I walk through the 7-Step Pathway to Profit and identify which of your seven levers is your actual constraint.
It’s a research conversation, not a sales pitch. I’m gathering breakthrough stories for the book while sharing what I’m learning about constraint identification across different industries. Most business owners walk away knowing exactly which lever to focus on in first quarter to create momentum for the rest of 2026.
If you’d like to participate and receive a free copy of the book when it’s published in 2026, you can schedule here: https://mediaaceadvisors.com/contact/
There’s no cost and no sales pitch. These are real research conversations. I’ll show you your seven levers, identify your constraint, and give you a quarterly target for the first quarter. You’ll know what to focus on, I’ll get insights for the book. If you’re tired of watching your revenue reset to zero every January without hitting your goal, let’s talk before the first quarter ends.
This is the year you don’t watch the reset happen again. This is the year you break through.
About the Author:
I’m Ryan Herrst with Media Ace Advisors. I help service business owners with annual revenue between $250,000 and $3 million identify hidden profit opportunities and create clear pathways to growth. My approach focuses on systematic improvements across all seven profit levers, with special emphasis on constraint identification and breakthrough planning.
One Response
Với hơn 10 năm kinh nghiệm, 888SLOT đã trở thành biểu tượng trong giới cá cược online nhờ dịch vụ chuyên nghiệp và chương trình khuyến mãi liên tục. TONY03-25